Machine Learning · Public GitHub Repository
ML Decision Surfaces Lab
Interactive Machine Learning Exploration
An interactive Gradio environment for comparing classification and regression models through decision boundaries, ROC-AUC, confusion matrices, learning curves, and controlled noise experiments.
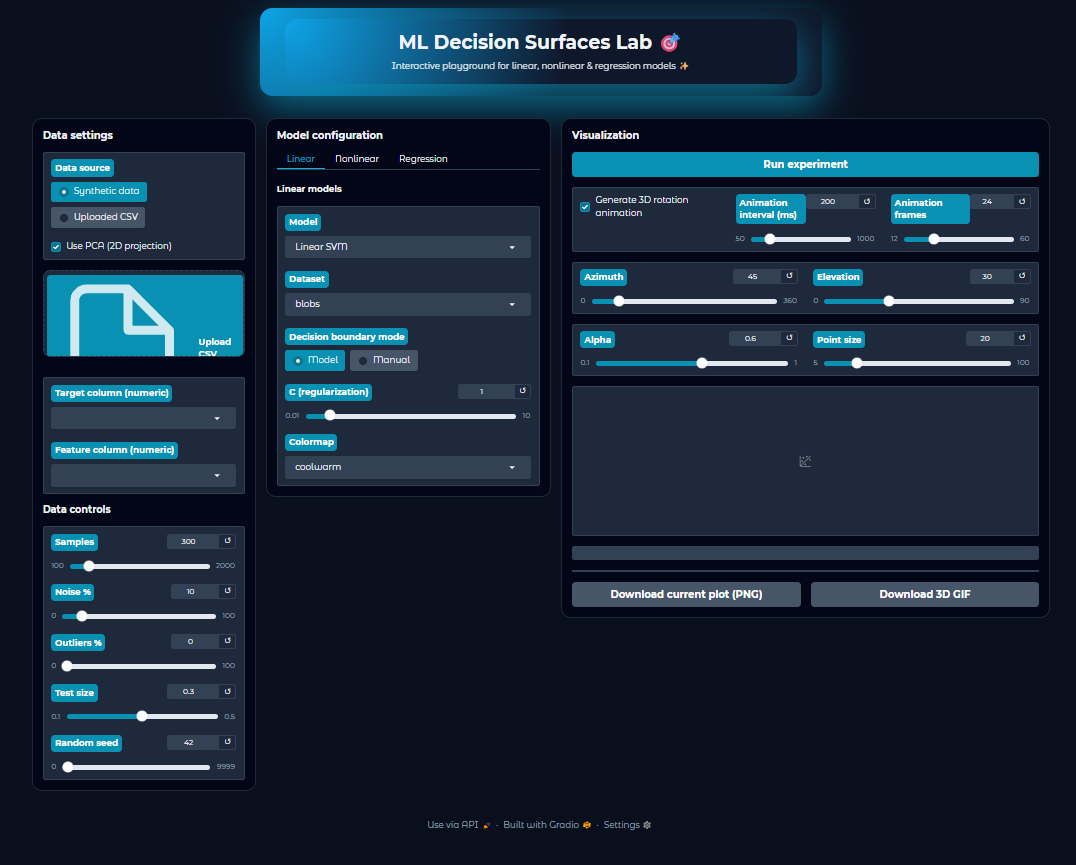
OVERVIEW
An interactive lab for seeing how machine-learning models behave.
ML Decision Surfaces Lab is a hands-on Gradio playground for exploring classification and regression models through decision regions, 3D surfaces, ROC/AUC, confusion matrices, learning curves, and model diagnostics. The interface is designed to make model behavior visible while users vary datasets, hyperparameters, noise, outliers, train/test split, and visualization controls.
CORE CAPABILITIES
Linear classification, nonlinear classification, and regression workflows in one interface.
Generate built-in datasets or upload numeric CSV data and choose the working columns.
Adjust noise, outliers, test size, random seed, model settings, and visualization parameters.
Inspect ROC/AUC, confusion matrices, learning curves, distributions, coefficients, and feature importance where applicable.
Explore 2D decision regions alongside 3D decision or regression surfaces.
Download the current plot as PNG and generate a rotating 3D GIF from the visualization.
WORKFLOW
From data choice to visual model diagnosis.
The lab keeps the experimental loop short: choose a task, choose or upload data, configure the model and stress conditions, run the experiment, then inspect the resulting plots and metrics.
Linear classification, nonlinear classification, or regression.
Use a synthetic dataset or upload a numeric CSV.
Adjust model settings, noise, outliers, split, seed, PCA, and visualization controls.
Review 2D/3D surfaces, diagnostics, metrics, and exportable visual output.
MODEL FAMILIES
PROJECT GALLERY
One interface, many model behaviors.
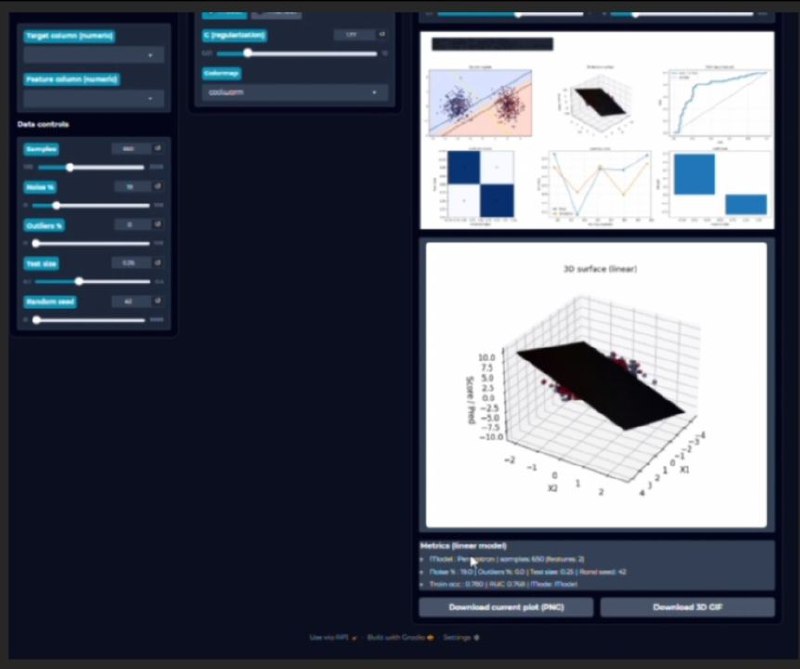
The screenshots below show the same laboratory adapting to different datasets and model families rather than a single curated result.
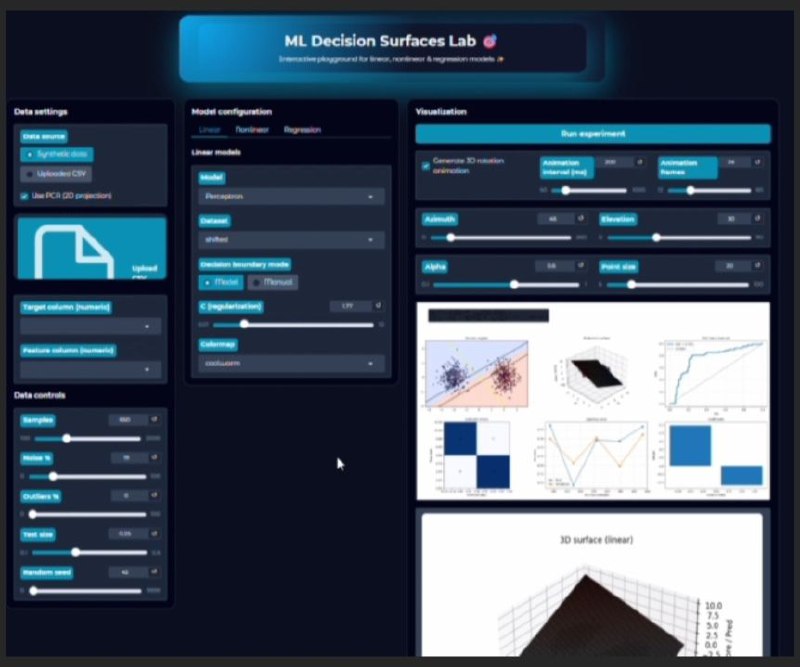 Open full size ↗
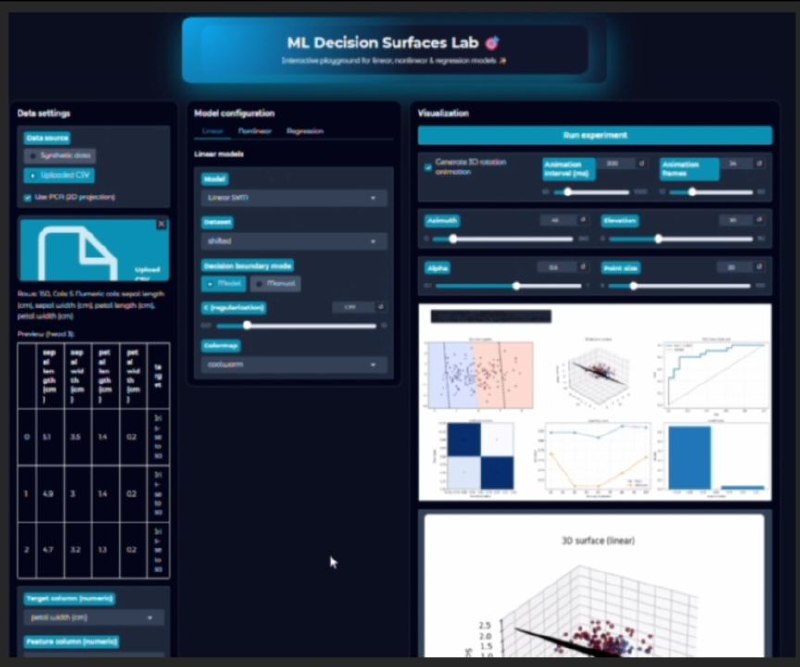 Open full size ↗
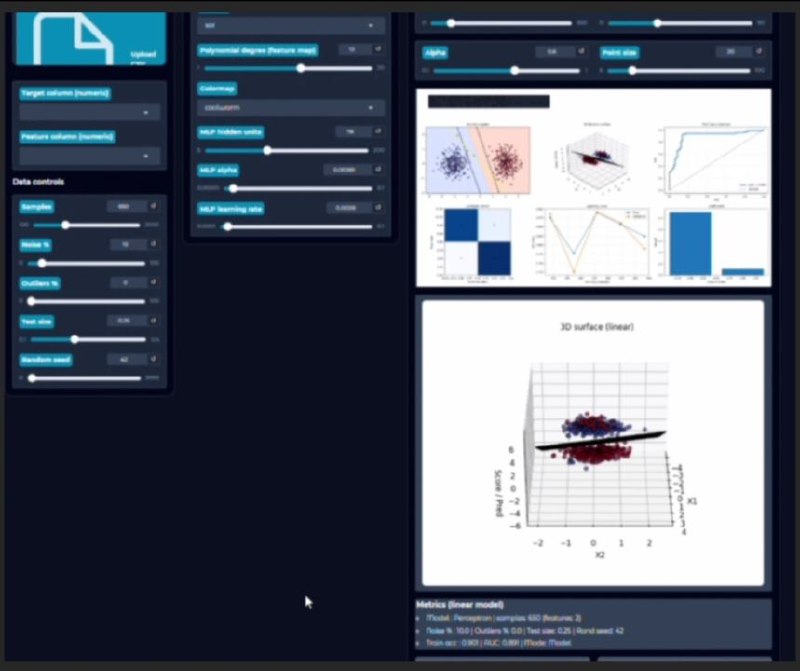 Open full size ↗
 Open full size ↗
DEMO
Interactive walkthrough
A recorded tutorial demonstrates the current implementation and how the experiment controls, plots, and model views work together.
TECHNICAL DETAILS
InterfaceGradio interactive controls and experiment workflow
Machine learningscikit-learn classifiers, regressors, dataset generators, metrics, PCA
VisualizationMatplotlib 2D decision regions, 3D surfaces, learning curves, ROC and diagnostic plots
Stress testingLabel/target noise, synthetic outliers, train/test split, random seed
ExportPNG plot output and animated 3D rotation GIF
ENGINEERING VALUE
More than a chart generator.
The project brings data generation, model configuration, evaluation, robustness experiments, and visualization into one repeatable workflow. Its value is in making the relationship between data geometry, model choice, hyperparameters, and evaluation behavior easier to inspect interactively.
Model behavior becomes tangible
Changing the dataset or model immediately changes the visible decision geometry, helping connect mathematical assumptions with outcomes.
Robustness can be explored directly
Noise and outlier controls make it possible to observe how different model families respond under degraded data conditions.
Evaluation is contextual
ROC, confusion matrices, learning curves, and decision surfaces are viewed together instead of as isolated metrics.
The interface supports experimentation
Reusable controls turn the notebook-style workflow into a more accessible interactive laboratory.
Planned evolution: richer model interpretation and intelligent visual analysis may be explored in future versions after the current lab is further developed.
PUBLIC REPOSITORY